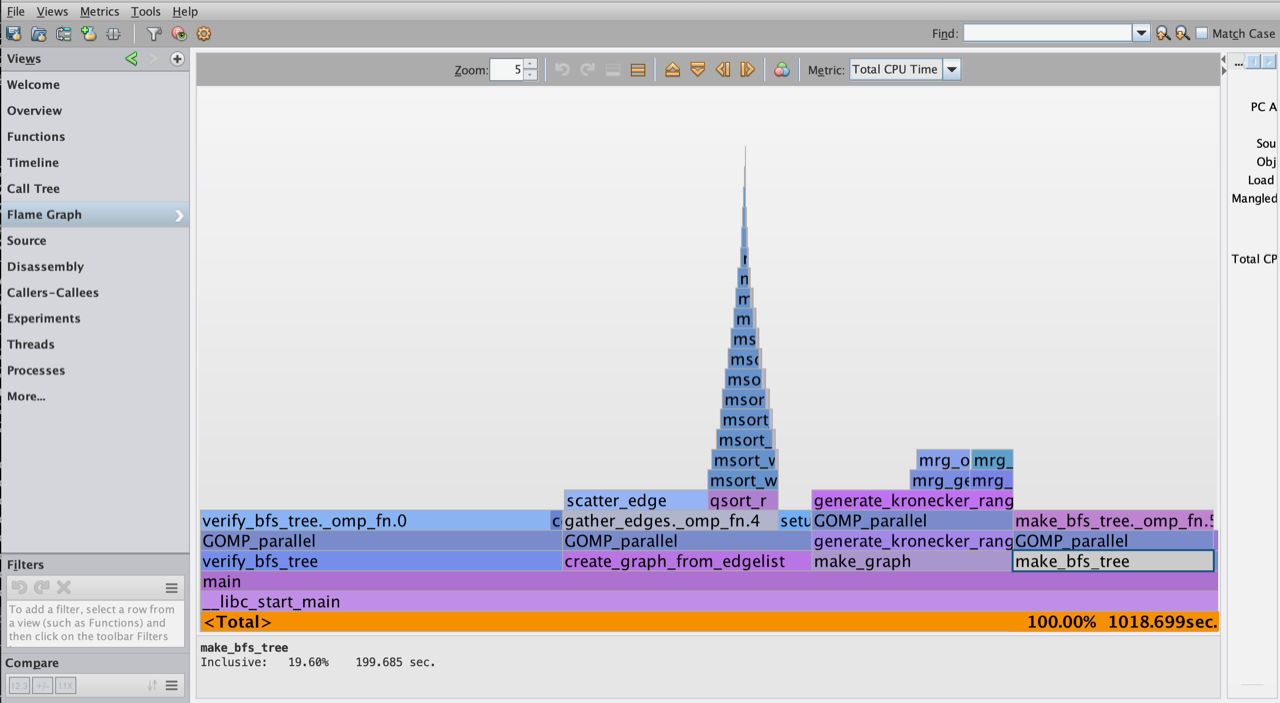
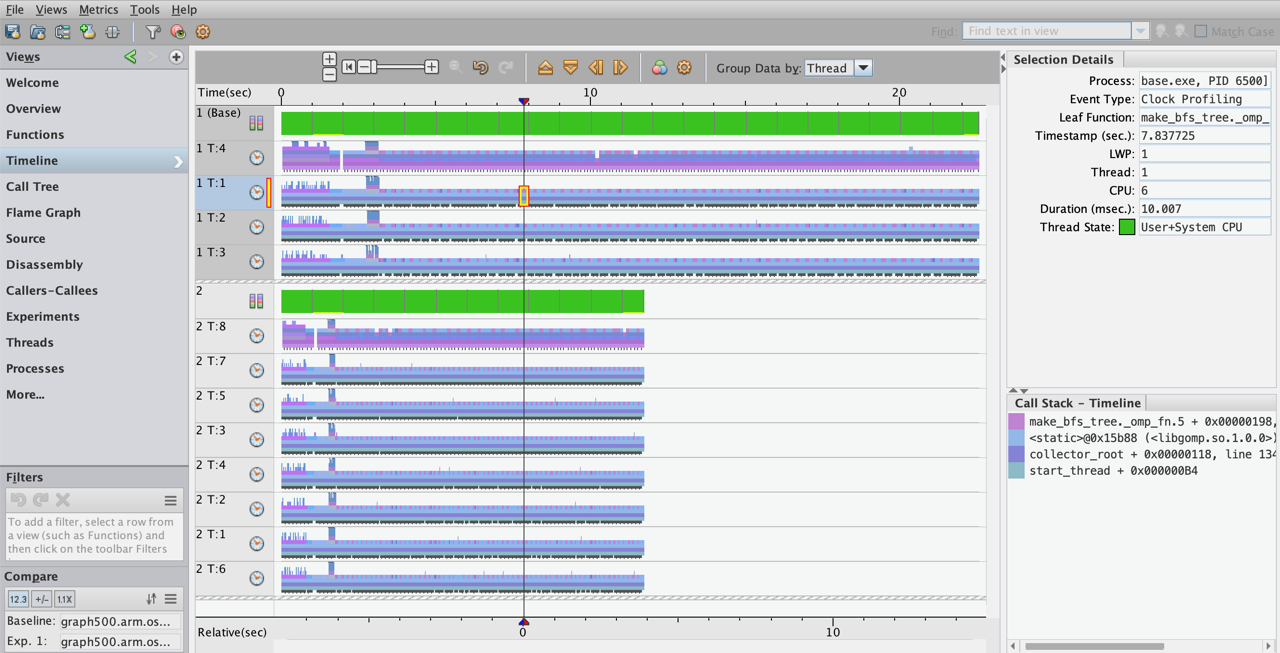
* [PATCH] gprofng: a new GNU profiler
       [not found] <f01abee8-b329-0e39-2cef-0a0cec0adda4@oracle.com>
@ 2021-08-11 21:10 ` Vladimir Mezentsev
  2021-08-11 21:48   ` Joseph Myers
                     ` (3 more replies)
  0 siblings, 4 replies; 16+ messages in thread
From: Vladimir Mezentsev @ 2021-08-11 21:10 UTC (permalink / raw)
  To: binutils


Hi people!

In this submission we are contributing a new profiler to the GNU binary
utilities, called gprofng (for GNU profiler, next generation).

Why a new profiler?
===================

The GNU profiler, gprof, works well enough in many cases. However, it
hasn't aged well and it is not that very well suited for profiling
modern-world applications. Examples of its limitations are lack of support
for profiling multithreaded programs, and shared objects. Both are
ubiquitous nowadays.

Main characteristics of gprofng
===============================

gprofng supports profiling C, C++ and Java programs. Unlike the old
gprof, it doesn't require to build annotated versions of the programs.
Profiling "production" binaries should work just fine.

Another distinguishing feature of gprofng is the support for various filters
that allow the user to easily drill deeper into an area of interest.

The profiler is commanded through a driver program called `gprofng'.
This driver supports the following sub-commands:

gpronfg collect app EXECUTABLE

This runs EXECUTABLE and collects application performance data.

gprofng display text EXPERIMENT

This runs a client command-line interface that provides access to the
collected performance data stored in the experiment directory.

gprofng display html EXPERIMENT

This generates an HTML report from the collected performance data.
stored in the experiment directory.

gprofng display src OBJECT-FILE

This displays source (if available) or disassembly interleaved
with the source code.

gprofng archive EXPERIMENT

Archive the associated application binaries, load objects and source
files in an existing experiment directory to make it self contained.

There is also an extensive graphical user interface (written in Java)
that displays and analyzes gprofng collected data in a very sophisticated
way. We plan to release this GUI as a separate project.

While WIP, we would like to share some screenshots of the current
development version. These show the following:

pic1.png - a flame graph:
https://jemarch.net/gprofng-pics/pic1.png

pic2.png - color coded call stacks as a function of time ("the timeline"):
https://jemarch.net/gprofng-pics/pic2.png

pic3.png - zoom in on the timeline and adapt colors to identify details:
https://jemarch.net/gprofng-pics/pic3.png

pic4.png - compare two mulithreaded profiles:
https://jemarch.net/gprofng-pics/pic4.png

Some notes on the implementation
================================

- The gp-display-html tool is written in Perl. All other components are
written in C/C++.

- gprofng sources are mostly contained in a new top-level directory
gprofng/ that in turn contains:

+ src/ contains the source code of the gp-* programs and libgprofng.

+ libcollector/ contains the sources of libcollector.

+ common/ contains a few source files that are used by both the gp-*
utilities and libcollector.

+ doc/ contains the Texinfo sources for the gprofng manual.

+ testsuite/ contains the gprofng testsuite.

Three installed header files are distributed in the top-level include/
directory. These are libcollector.h, libfcollector.h, and
collectorAPI.h.

- Currently gprofng supports profiling programs in GNU/Linux systems
running on x86_64 and aarch64 hardware. It is possible to add support
for additional architectures.

- The tools come with a set of man pages. They are generated upon
installation and can be found in the installation directory under
share/man/man1.

Platform support
================

The basic profiling features are supported on most processors from
Intel. Regarding AMD we did not yet test on their recent EPYC
processors, but do not expect serious issues. We also support the Arm
processors as used in systems from Ampere.

Hardware event counters, which are optional and used by gprofng in
advanced profiling, are supported for many modern Intel and AMD
processors. If a particular processor is not supported, a warning
message will be issued when trying to run an event counter experiment.

This code has been developed and tested on Oracle Linux 8 with the
latest GNU toolchain from the sourceware git repos.

Structure of the patch series
=============================

The first patch is preparatory and makes the x86 disassembler in opcodes
to be thread-safe. This is so it can be used by gprofng.

The second patch is the implementation of gprofng proper. This includes
source code for the libraries (libcollector, libgprofng) and the
utilities (gp-collect, etc).

In this patch there are also updates to the corresponding build machinery
(e.g. configure.ac, Makefile.def, plus binutils/MAINTAINERS to cover
gprofng)

The third patch adds a testsuite in gprofng/testsuite.

The fourth patch adds a Texinfo manual for gprofng. The manual is still
WIP but already provides a tutorial-like introduction to the tools.

Where to find the patch series
==============================

Due to the size of the contribution, we thought it would be better to
submit it in the form of a git branch instead of a regular emailed patch
series.

Repository: https://www.github.com/oracle/binutils-gdb
Branch: oracle/gprofng-v1

We hope this will make it easier for the maintainers to review the
tools. We suggest having feedback and discussion in this mail thread.

Limitations
===========

The gp-display-html tool is present, and can be executed, but it is not
functional yet. Full support for this tool is expected to be delivered
in a future patch.

Requirements
===========

In order to successfully build gprofng, the following versions of
external components are required:

- Bison 3.7.5, or higher
- Texinfo 6.7, or higher
- Java include files (--with-jdk=PATH) if java profiling should be enabled

Maintenance
===========

We are of course volunteering to maintain gprofng once it is
incorporated into the main binutils distribution.


^ permalink raw reply	[flat|nested] 16+ messages in thread
* Re: [PATCH] gprofng: a new GNU profiler
  2021-08-11 21:10 ` [PATCH] gprofng: a new GNU profiler Vladimir Mezentsev
@ 2021-08-11 21:48   ` Joseph Myers
  2021-08-11 22:27     ` Vladimir Mezentsev
  2021-08-12 11:48   ` Jose E. Marchesi
                     ` (2 subsequent siblings)
  3 siblings, 1 reply; 16+ messages in thread
From: Joseph Myers @ 2021-08-11 21:48 UTC (permalink / raw)
  To: Vladimir Mezentsev; +Cc: binutils

On Wed, 11 Aug 2021, Vladimir Mezentsev via Binutils wrote:

> - Currently gprofng supports profiling programs in GNU/Linux systems
> running on x86_64 and aarch64 hardware. It is possible to add support
> for additional architectures.

Have you made sure that if binutils is built for a host or target not
supported by gprofng, or lacking any build dependencies of gprofng that
are not build dependencies of the rest of binutils, it disables building
that subdirectory rather than failing the build?

Suppose you build cross binutils.  What functionality is present for
gprofng?  Does it build a cross gprofng that can read profile data that
was collected natively (by a native gprofng) on a system of the configured
--target, while not itself being able to collect profile data, for
example?  That's what seems logical for cross gprofng to be able to do -
everything related to processing profile data for the configured target
(regardless of what the host architecture or OS are) other than natively
collecting it - but I don't know if it's designed that way, or whether you
e.g. depend on structures describing the profile data that may not be so
readily available in such a configuration.

--
Joseph S. Myers
joseph@codesourcery.com

^ permalink raw reply	[flat|nested] 16+ messages in thread
* Re: [PATCH] gprofng: a new GNU profiler
  2021-08-11 21:48   ` Joseph Myers
@ 2021-08-11 22:27     ` Vladimir Mezentsev
  2021-08-12 12:49       ` Joseph Myers
  0 siblings, 1 reply; 16+ messages in thread
From: Vladimir Mezentsev @ 2021-08-11 22:27 UTC (permalink / raw)
  To: Joseph Myers; +Cc: binutils


On 8/11/21 2:48 PM, Joseph Myers wrote:
> On Wed, 11 Aug 2021, Vladimir Mezentsev via Binutils wrote:
>
>> - Currently gprofng supports profiling programs in GNU/Linux systems
>> running on x86_64 and aarch64 hardware. It is possible to add support
>> for additional architectures.
> Have you made sure that if binutils is built for a host or target not
> supported by gprofng, or lacking any build dependencies of gprofng that
> are not build dependencies of the rest of binutils, it disables building
> that subdirectory rather than failing the build?
  Joseph, thank you for your questions.

gprofng can be built for the  x86_64, i686 or aarch64 platforms.
For the other platforms, the gprofng build is turned off.
gprofng depends on libbfd and libopcodes.
If they are not built the gprofng build failed.


>
> Suppose you build cross binutils.  What functionality is present for
> gprofng?  Does it build a cross gprofng that can read profile data that
> was collected natively (by a native gprofng) on a system of the configured
> --target, while not itself being able to collect profile data, for
> example?  That's what seems logical for cross gprofng to be able to do -
> everything related to processing profile data for the configured target
> (regardless of what the host architecture or OS are) other than natively
> collecting it - but I don't know if it's designed that way, or whether you
> e.g. depend on structures describing the profile data that may not be so
> readily available in such a configuration.

  You can collect data only natively.
But you can see the  profile data on the other hardware.
For example, you can collect data on aarch64 and see this data on x86_64.
Or you can collect data on x86_64 and see this data on aarch64.

Thank you,
-Vladimir


>


^ permalink raw reply	[flat|nested] 16+ messages in thread
* Re: [PATCH] gprofng: a new GNU profiler
  2021-08-11 22:27     ` Vladimir Mezentsev
@ 2021-08-12 12:49       ` Joseph Myers
  2021-08-12 14:50         ` Joseph Myers
  2021-08-12 23:35         ` Vladimir Mezentsev
  0 siblings, 2 replies; 16+ messages in thread
From: Joseph Myers @ 2021-08-12 12:49 UTC (permalink / raw)
  To: Vladimir Mezentsev; +Cc: binutils

On Wed, 11 Aug 2021, Vladimir Mezentsev wrote:

> gprofng can be built for the  x86_64, i686 or aarch64 platforms.
> For the other platforms, the gprofng build is turned off.

Could you point to the relevant parts of the patches that implement this
turning off?  Is it the case statement on ${target} in
gprofng/configure.ac?

What happens if building for e.g. --host=powerpc64le-linux-gnu
--target=aarch64-linux-gnu?  Does that produce a gprofng binary that can
process data collected on AArch64, while not supporting native collection?

I'm concerned about the definitions such as -D__i386 that you're using
based on the target, because there might be host headers using such
defines to test whether the *host* is i386.  I think you need to avoid any
defines of such macros for target properties that might be confused with
macros for host properties defined by host compilers (and correspondingly
adjust any #ifdef in the gprofng code so it uses e.g. TARGET_I386
conditionals that cannot be confused with conditionals for the host
architecture).

The target patterns you have in gprofng/configure.ac seem rather
restrictive.  Does it really need to be restricted to *-linux-gnu or would
e.g. -linux-uclibc and -linux-musl work just as well if the target used
*-linux*?  Does it need to be restricted to i686 not i?86 covering e.g.
i486 or i586 targets as well?  Does it need to be restricted to aarch64
(i.e. tools defaulting to little-endian) rather than allowing aarch64* (so
including aarch64_be as well)?

For x86_64/i686, binutils supports both 32-bit and 64-bit code generation
(by default for x86_64; for i686 if --enable-64-bit-bfd).  Can gprofng
support that, i.e. x86_64, or i686 --enable-64-bit-bfd, gprofng support
processing data collected on the relevant architecture, and support native
collection for both 32-bit and 64-bit binaries if built as native?

I don't think the tests for specific paths in /usr, e.g. /usr/bin/javac,
are a good idea.  If testing for a tool such as Java, you should look for
it in the PATH rather than making assumptions that a version in a specific
directory such as /usr is the right one to use.

--
Joseph S. Myers
joseph@codesourcery.com

^ permalink raw reply	[flat|nested] 16+ messages in thread
* Re: [PATCH] gprofng: a new GNU profiler
  2021-08-12 12:49       ` Joseph Myers
@ 2021-08-12 14:50         ` Joseph Myers
  2021-08-12 23:35         ` Vladimir Mezentsev
  1 sibling, 0 replies; 16+ messages in thread
From: Joseph Myers @ 2021-08-12 14:50 UTC (permalink / raw)
  To: Vladimir Mezentsev; +Cc: binutils

On Thu, 12 Aug 2021, Joseph Myers wrote:

> I'm concerned about the definitions such as -D__i386 that you're using
> based on the target, because there might be host headers using such
> defines to test whether the *host* is i386.  I think you need to avoid any

And, in any case, an i386 compiler predefines __i386 itself.  So the
effect of this patch is that "#ifdef __i386" conditionals in gprofng
itself will be active both for i386 host (possibly with a non-i386
target), where the compiler predefines the macro and for i386 target
(possibly with a non-i386 host), where configure.ac defines the macro.
That seems unlikely to be correct.

You'll need to figure out, for each such conditional in gprofng, whether
(a) it should be a host conditional (there should be very few if any host
conditionals in portable code), (b) it should be a target conditional or
(c) the code it's in is native-only and shouldn't be built at all if host
!= target.

--
Joseph S. Myers
joseph@codesourcery.com

^ permalink raw reply	[flat|nested] 16+ messages in thread
* Re: [PATCH] gprofng: a new GNU profiler
  2021-08-12 12:49       ` Joseph Myers
  2021-08-12 14:50         ` Joseph Myers
@ 2021-08-12 23:35         ` Vladimir Mezentsev
  2021-08-13 16:25           ` Joseph Myers
  1 sibling, 1 reply; 16+ messages in thread
From: Vladimir Mezentsev @ 2021-08-12 23:35 UTC (permalink / raw)
  To: Joseph Myers; +Cc: binutils


On 8/12/21 5:49 AM, Joseph Myers wrote:
> On Wed, 11 Aug 2021, Vladimir Mezentsev wrote:
>
>> gprofng can be built for the  x86_64, i686 or aarch64 platforms.
>> For the other platforms, the gprofng build is turned off.
> Could you point to the relevant parts of the patches that implement this
> turning off?  Is it the case statement on ${target} in
> gprofng/configure.ac?

  yes. It is the case statement on ${target} in gprofng/configure.ac

>
> What happens if building for e.g. --host=powerpc64le-linux-gnu
> --target=aarch64-linux-gnu?  Does that produce a gprofng binary that can
> process data collected on AArch64, while not supporting native collection?
gprofng has two parts:
    1. to collect data. It is libraries: libgp-collector.so,
libgp-heap.so, ...
    2. to display data.

(2) is independent on machines. It is implemented in c++.
  It was built and tested with gcc8 and gcc11 on X86_64 and aarch64
(Linux ol8)

(1) is implemented in c. The code is native-only. It should be built and
used when host == target.
(1) was built and tested on X86_64 and aarch64.
On X86_64,  we build  32-bit and 64-bit libraries to profile the 32-bit
and 64-bit applications.

>
> I'm concerned about the definitions such as -D__i386 that you're using
> based on the target, because there might be host headers using such
> defines to test whether the *host* is i386.  I think you need to avoid any
> defines of such macros for target properties that might be confused with
> macros for host properties defined by host compilers (and correspondingly
> adjust any #ifdef in the gprofng code so it uses e.g. TARGET_I386
> conditionals that cannot be confused with conditionals for the host
> architecture).
   Agree.
  I will see how the other parts of binutils deal with this and fix gprofng.


>
> The target patterns you have in gprofng/configure.ac seem rather
> restrictive.  Does it really need to be restricted to *-linux-gnu or would
> e.g. -linux-uclibc and -linux-musl work just as well if the target used
> *-linux*?  Does it need to be restricted to i686 not i?86 covering e.g.
> i486 or i586 targets as well?

Only these three targets were built and tested:
     x86_64-*-linux-gnu
     i686-*-linux-gnu
     aarch64-*-linux-gnu

The other configurations were not available to me.


>    Does it need to be restricted to aarch64
> (i.e. tools defaulting to little-endian) rather than allowing aarch64* (so
> including aarch64_be as well)?

We need to know where we build.
We use -D__amd64, -D__i386, -D__aarch64 for it.

I agree  that we should not use these defines to determine the byte order.
Moreover,  we should not use these defines.
I will fix it.


> For x86_64/i686, binutils supports both 32-bit and 64-bit code generation
> (by default for x86_64; for i686 if --enable-64-bit-bfd).  Can gprofng
> support that, i.e. x86_64, or i686 --enable-64-bit-bfd, gprofng support
> processing data collected on the relevant architecture, and support native
> collection for both 32-bit and 64-bit binaries if built as native?

For x86_64, I build twice. One is  for 64-bit gprofng. The other is for
32-bit libraries only:
1. --prefix=INSTALL_DIR --enable-shared
2. --prefix=INSTALL_DIR --enable-shared CFLAGS=-m32 CXXFLAGS=-m32
CCFLAGS=-m32 --target=i686-pc-linux-gnu --libdir=INSTAL_DIR/lib32

Is it correct ?
How do you build binutils-gdb for x86_64/i686?

>
> I don't think the tests for specific paths in /usr, e.g. /usr/bin/javac,
> are a good idea.

Agree. Not good idea. I will fix it too.

>   If testing for a tool such as Java, you should look for
> it in the PATH rather than making assumptions that a version in a specific
> directory such as /usr is the right one to use.

   We don't really need java or javac.
We need jni.h for build to support java profiling.


Joseph, thank you for review.

-Vladimir


^ permalink raw reply	[flat|nested] 16+ messages in thread
* Re: [PATCH] gprofng: a new GNU profiler
  2021-08-12 23:35         ` Vladimir Mezentsev
@ 2021-08-13 16:25           ` Joseph Myers
  2021-08-16 20:06             ` Vladimir Mezentsev
  0 siblings, 1 reply; 16+ messages in thread
From: Joseph Myers @ 2021-08-13 16:25 UTC (permalink / raw)
  To: Vladimir Mezentsev; +Cc: binutils

On Thu, 12 Aug 2021, Vladimir Mezentsev via Binutils wrote:

> > The target patterns you have in gprofng/configure.ac seem rather
> > restrictive.  Does it really need to be restricted to *-linux-gnu or would
> > e.g. -linux-uclibc and -linux-musl work just as well if the target used
> > *-linux*?  Does it need to be restricted to i686 not i?86 covering e.g.
> > i486 or i586 targets as well?
>
> Only these three targets were built and tested:
>     x86_64-*-linux-gnu
>     i686-*-linux-gnu
>     aarch64-*-linux-gnu
>
> The other configurations were not available to me.

Normally we make functionality available on all platforms where it can
reasonably be expected to work; we don't restrict it to (for example)
*-linux-gnu instead of the more general *-linux* without a concrete reason
why it won't work with other libc implementations.  So if this
functionality depends on hardware and Linux kernel features, but not on
details of what libc implementation is used on the target or what
endianness is in use, that would be x86_64-*-linux*, i?86-*-linux* and
aarch64*-*-linux*.

> We need to know where we build.
> We use -D__amd64, -D__i386, -D__aarch64 for it.

For native-only code, you should be able to rely on the macros predefined
by the compiler, such as __x86_64__ and __i386__, without needing to
define your own.  If you do need to define your own, it would be best to
use names such as NATIVE_I386 that definitely do not conflict with
anything predefined by a compiler.

> > For x86_64/i686, binutils supports both 32-bit and 64-bit code generation
> > (by default for x86_64; for i686 if --enable-64-bit-bfd).  Can gprofng
> > support that, i.e. x86_64, or i686 --enable-64-bit-bfd, gprofng support
> > processing data collected on the relevant architecture, and support native
> > collection for both 32-bit and 64-bit binaries if built as native?
>
> For x86_64, I build twice. One is  for 64-bit gprofng. The other is for 32-bit
> libraries only:
> 1. --prefix=INSTALL_DIR --enable-shared
> 2. --prefix=INSTALL_DIR --enable-shared CFLAGS=-m32 CXXFLAGS=-m32
> CCFLAGS=-m32 --target=i686-pc-linux-gnu --libdir=INSTAL_DIR/lib32
>
> Is it correct ?
> How do you build binutils-gdb for x86_64/i686?

A single 64-bit GDB binary can debug both 32-bit and 64-bit (and x32)
inferiors (a 32-bit GDB binary can't debug 64-bit inferiors, however, for
lack of appropriate kernel interfaces in the 32-bit syscall interface),
and a single set of binutils binaries (either 32-bit or 64-bit) can
support assembling / linking both 32-bit and 64-bit code (with appropriate
options passed to e.g. the assembler to tell it whether to generate 32-bit
or 64-bit output).  It's clearly preferable to support that if possible.
Is it practical to support that in gprofng, or does it depend on kernel
interfaces that aren't available for the case of a 64-bit process
operating on a 32-bit one, or on loading libraries in the profiled
process's address space that thus need to be built separately for each
ABI?

--
Joseph S. Myers
joseph@codesourcery.com

^ permalink raw reply	[flat|nested] 16+ messages in thread
* Re: [PATCH] gprofng: a new GNU profiler
  2021-08-13 16:25           ` Joseph Myers
@ 2021-08-16 20:06             ` Vladimir Mezentsev
  2021-08-16 20:35               ` Joseph Myers
  0 siblings, 1 reply; 16+ messages in thread
From: Vladimir Mezentsev @ 2021-08-16 20:06 UTC (permalink / raw)
  To: Joseph Myers; +Cc: binutils


On 8/13/21 9:25 AM, Joseph Myers wrote:
> On Thu, 12 Aug 2021, Vladimir Mezentsev via Binutils wrote:
>
>
>>> For x86_64/i686, binutils supports both 32-bit and 64-bit code generation
>>> (by default for x86_64; for i686 if --enable-64-bit-bfd).  Can gprofng
>>> support that, i.e. x86_64, or i686 --enable-64-bit-bfd, gprofng support
>>> processing data collected on the relevant architecture, and support native
>>> collection for both 32-bit and 64-bit binaries if built as native?
>> For x86_64, I build twice. One is  for 64-bit gprofng. The other is for 32-bit
>> libraries only:
>> 1. --prefix=INSTALL_DIR --enable-shared
>> 2. --prefix=INSTALL_DIR --enable-shared CFLAGS=-m32 CXXFLAGS=-m32
>> CCFLAGS=-m32 --target=i686-pc-linux-gnu --libdir=INSTAL_DIR/lib32
>>
>> Is it correct ?
>> How do you build binutils-gdb for x86_64/i686?
> A single 64-bit GDB binary can debug both 32-bit and 64-bit (and x32)
> inferiors (a 32-bit GDB binary can't debug 64-bit inferiors, however, for
> lack of appropriate kernel interfaces in the 32-bit syscall interface),
> and a single set of binutils binaries (either 32-bit or 64-bit) can
> support assembling / linking both 32-bit and 64-bit code (with appropriate
> options passed to e.g. the assembler to tell it whether to generate 32-bit
> or 64-bit output).  It's clearly preferable to support that if possible.
> Is it practical to support that in gprofng, or does it depend on kernel
> interfaces that aren't available for the case of a 64-bit process
> operating on a 32-bit one, or on loading libraries in the profiled
> process's address space that thus need to be built separately for each
> ABI?
>

We use LD_PRELOAD to load our library in the profiled process's address
space.
As I understand, we can not build together our 32-bit and 64-bit libraries.
We should build separately for each ABI.
If it is correct, how should I configure my build for the 32-bit ABI on
x86_64 ?
Is it correct :
    --enable-shared CFLAGS=-m32 CXXFLAGS=-m32 CCFLAGS=-m32
--target=i686-pc-linux-gnu --prefix=INSTALL_DIR --libdir=INSTAL_DIR/lib32


Thank you,
-Vladimir

^ permalink raw reply	[flat|nested] 16+ messages in thread
* Re: [PATCH] gprofng: a new GNU profiler
  2021-08-16 20:06             ` Vladimir Mezentsev
@ 2021-08-16 20:35               ` Joseph Myers
  0 siblings, 0 replies; 16+ messages in thread
From: Joseph Myers @ 2021-08-16 20:35 UTC (permalink / raw)
  To: Vladimir Mezentsev; +Cc: binutils

On Mon, 16 Aug 2021, Vladimir Mezentsev via Binutils wrote:

> We use LD_PRELOAD to load our library in the profiled process's address space.
> As I understand, we can not build together our 32-bit and 64-bit libraries.
> We should build separately for each ABI.

Yes, that library should be built separately.

A distribution for x86_64 should, I hope, be able to have a single build
of the gprofng host tools, and three separate builds of the libraries for
the three ABIs (in multilib or multiarch directories depending on what's
used by the distribution), unless the host tools need to be able to load
the same libraries for the same ABI, or something like that.  So you
should make sure it's straightforward to build just the host tools that
only need to be built once, or to build just the libraries (for a single
ABI) that need to be built separately for each ABI, and document
(somewhere checked into the repository and kept up to date as the
information changes, not just in emails or commit messages) how to do
these builds and how to tell the host gprofng tools where to fine the
libraries.

> If it is correct, how should I configure my build for the 32-bit ABI on x86_64
> ?
> Is it correct :
>    --enable-shared CFLAGS=-m32 CXXFLAGS=-m32 CCFLAGS=-m32
> --target=i686-pc-linux-gnu --prefix=INSTALL_DIR --libdir=INSTAL_DIR/lib32

For options required to be used in all compilations, they should go in CC
and CXX, not CFLAGS and CXXFLAGS (CFLAGS and CXXFLAGS are for
non-ABI-changing, non-semantic options such as -g -O2).

lib32 isn't a directory name normally used on x86, though some systems
might use it.  Multilib directory arrangements conventially use (lib64,
lib, libx32) as the directory names for 64-bit, 32-bit and x32 libraries.
Multiarch directory arrangements use (lib/x86_64-linux-gnu,
lib/i386-linux-gnu, lib/x86_64-linux-gnux32) as documented at
<https://wiki.debian.org/Multiarch/Tuples>.

--
Joseph S. Myers
joseph@codesourcery.com

^ permalink raw reply	[flat|nested] 16+ messages in thread
* Re: [PATCH] gprofng: a new GNU profiler
  2021-08-11 21:10 ` [PATCH] gprofng: a new GNU profiler Vladimir Mezentsev
  2021-08-11 21:48   ` Joseph Myers
@ 2021-08-12 11:48   ` Jose E. Marchesi
  2021-08-13 20:22   ` Jim Wilson
  2021-10-08 16:23   ` Florian Weimer
  3 siblings, 0 replies; 16+ messages in thread
From: Jose E. Marchesi @ 2021-08-12 11:48 UTC (permalink / raw)
  To: Vladimir Mezentsev; +Cc: binutils


> Hi people!
>
> In this submission we are contributing a new profiler to the GNU binary
> utilities, called gprofng (for GNU profiler, next generation).

Ruud has recorded a short video (7 minutes) with a quick demo showing
gprofng in action.  It covers:

1. How to collect an experiment data from a multi-threaded program.

2. How to examine the collected profiling information at function level,
   source code level and assembly instruction level.

3. How to make gprofng to show information in a way that is most useful
   to your particular needs, instead of relying on defaults.

You can find the video at
https://jemarch.net/gprofng-pics/gprofng-quick-demo.mp4

Salud!

^ permalink raw reply	[flat|nested] 16+ messages in thread
* Re: [PATCH] gprofng: a new GNU profiler
  2021-08-11 21:10 ` [PATCH] gprofng: a new GNU profiler Vladimir Mezentsev
  2021-08-11 21:48   ` Joseph Myers
  2021-08-12 11:48   ` Jose E. Marchesi
@ 2021-08-13 20:22   ` Jim Wilson
  2021-08-14  5:09     ` Ruud van der Pas
  2021-10-08 16:23   ` Florian Weimer
  3 siblings, 1 reply; 16+ messages in thread
From: Jim Wilson @ 2021-08-13 20:22 UTC (permalink / raw)
  To: Vladimir Mezentsev; +Cc: Binutils

On Wed, Aug 11, 2021 at 2:11 PM Vladimir Mezentsev via Binutils <
binutils@sourceware.org> wrote:

> Repository: https://www.github.com/oracle/binutils-gdb
> Branch: oracle/gprofng-v1
>

Just taking a quick look at this, I noticed in src/machinemodels there is a
m5.ermm file that claims to support M5 systems, but doesn't say whose m5
system it is for.  Presumably this is some oracle system?  Checking the
code, these are apparently sparc chip names not oracle system names.  That
suggests that the file should be sparc-m5.ermm instead.  Or if we will need
a lot of these files maybe put them in a sparc subdir.  Meanwhile the m5
name by itself is ambiguous.

Jim

^ permalink raw reply	[flat|nested] 16+ messages in thread
* Re: [PATCH] gprofng: a new GNU profiler
  2021-08-13 20:22   ` Jim Wilson
@ 2021-08-14  5:09     ` Ruud van der Pas
  2021-08-16 12:02       ` Ruud van der Pas
  0 siblings, 1 reply; 16+ messages in thread
From: Ruud van der Pas @ 2021-08-14  5:09 UTC (permalink / raw)
  To: Jim Wilson; +Cc: Vladimir Mezentsev, Binutils

Hi Jim,

Thanks for the feedback!

My name is Ruud van der Pas and I’m another member of our gprofng team.

While Vladimir is our code expert, I can help with this question.

> Just taking a quick look at this, I noticed in src/machinemodels there is a
> m5.ermm file that claims to support M5 systems, but doesn't say whose m5
> system it is for.  Presumably this is some oracle system?  Checking the
> code, these are apparently sparc chip names not oracle system names.

Right. The M5 processor is a SPARC processor, but developed and manufactured
by Fujitsu. In addition to the in-house designed SPARC systems, Oracle also
sold these systems.

> That
> suggests that the file should be sparc-m5.ermm instead.  Or if we will need
> a lot of these files maybe put them in a sparc subdir.  Meanwhile the m5
> name by itself is ambiguous.

Thanks. A very good point and suggestion. We should do this. This is clearly a
legacy issue and has to be handled more clearly and cleanly.

Kind regards, Ruud


^ permalink raw reply	[flat|nested] 16+ messages in thread
* Re: [PATCH] gprofng: a new GNU profiler
  2021-08-14  5:09     ` Ruud van der Pas
@ 2021-08-16 12:02       ` Ruud van der Pas
  0 siblings, 0 replies; 16+ messages in thread
From: Ruud van der Pas @ 2021-08-16 12:02 UTC (permalink / raw)
  To: Jim Wilson; +Cc: Vladimir Mezentsev, Binutils

Hi Jim,

I’m sorry. I stand corrected.

The SPARC M5 processor was Oracle designed. I confused this with the
SPARC M-series systems from Fujitsu that used the Fujitsu designed
SPARC processors.

Kind regards, Ruud

> On 14 Aug 2021, at 07:09, Ruud van der Pas <ruud.vanderpas@oracle.com> wrote:
>
> Hi Jim,
>
> Thanks for the feedback!
>
> My name is Ruud van der Pas and I’m another member of our gprofng team.
>
> While Vladimir is our code expert, I can help with this question.
>
>> Just taking a quick look at this, I noticed in src/machinemodels there is a
>> m5.ermm file that claims to support M5 systems, but doesn't say whose m5
>> system it is for.  Presumably this is some oracle system?  Checking the
>> code, these are apparently sparc chip names not oracle system names.
>
> Right. The M5 processor is a SPARC processor, but developed and manufactured
> by Fujitsu. In addition to the in-house designed SPARC systems, Oracle also
> sold these systems.
>
>> That
>> suggests that the file should be sparc-m5.ermm instead.  Or if we will need
>> a lot of these files maybe put them in a sparc subdir.  Meanwhile the m5
>> name by itself is ambiguous.
>
> Thanks. A very good point and suggestion. We should do this. This is clearly a
> legacy issue and has to be handled more clearly and cleanly.
>
> Kind regards, Ruud
>


^ permalink raw reply	[flat|nested] 16+ messages in thread
* Re: [PATCH] gprofng: a new GNU profiler
  2021-08-11 21:10 ` [PATCH] gprofng: a new GNU profiler Vladimir Mezentsev
                     ` (2 preceding siblings ...)
  2021-08-13 20:22   ` Jim Wilson
@ 2021-10-08 16:23   ` Florian Weimer
  2021-10-08 17:59     ` Ruud van der Pas
  2021-10-11 20:00     ` Vladimir Mezentsev
  3 siblings, 2 replies; 16+ messages in thread
From: Florian Weimer @ 2021-10-08 16:23 UTC (permalink / raw)
  To: Vladimir Mezentsev via Binutils

* Vladimir Mezentsev via Binutils:

> In this submission we are contributing a new profiler to the GNU binary
> utilities, called gprofng (for GNU profiler, next generation).
>
> Why a new profiler?
> ===================
>
> The GNU profiler, gprof, works well enough in many cases. However, it
> hasn't aged well and it is not that very well suited for profiling
> modern-world applications. Examples of its limitations are lack of support
> for profiling multithreaded programs, and shared objects. Both are
> ubiquitous nowadays.

I find it odd to replace an instrumentation-based profiler with a
sampling-based profiler.

> gprofng archive EXPERIMENT
>
> Archive the associated application binaries, load objects and source
> files in an existing experiment directory to make it self contained.

This looks very useful.  Can it be generalized to support coredumps?
So that it is possible to get identical debugging experience on a
system where the necessary prerequisites are not installed?

^ permalink raw reply	[flat|nested] 16+ messages in thread
* Re: [PATCH] gprofng: a new GNU profiler
  2021-10-08 16:23   ` Florian Weimer
@ 2021-10-08 17:59     ` Ruud van der Pas
  2021-10-11 20:00     ` Vladimir Mezentsev
  1 sibling, 0 replies; 16+ messages in thread
From: Ruud van der Pas @ 2021-10-08 17:59 UTC (permalink / raw)
  To: Florian Weimer; +Cc: Vladimir Mezentsev via Binutils

Hi Florian,

Thanks for the feedback.

> I find it odd to replace an instrumentation-based profiler with a
> sampling-based profiler.

We’re not replacing gprof, or any other profiling tool for that matter.
They all have their merits and generally more than one tool is needed
for performance analysis.

There are definitely differences, both pros and cons, between instrumentation
and sampling. We think that the pros of sampling by far outweigh the cons,
but of course the user decides.

One thing we do not do is produce function call counts. While I found that
gprof sometimes drops the ball on that, in certain cases this is useful to know.

Having said that, I found that DTrace does a really good job at this. It
is also much more efficient and has full support for multithreading.

I wrote a blog on this:

https://blogs.oracle.com/linux/post/dtrace-for-the-application-developer-counting-function-calls

> This looks very useful.

Thsnks.

> Can it be generalized to support coredumps?
> So that it is possible to get identical debugging experience on a
> system where the necessary prerequisites are not installed?

I’m not sure how that would work. While gprofng can produce a profile
for a code that crashes, we do not have the infrastructure to handle
core files.

It might be better to perhaps leverage what we have, but integrate
this with either gdb (?), or maybe develop a separate tool.

Kind regards, Ruud


^ permalink raw reply	[flat|nested] 16+ messages in thread
* Re: [PATCH] gprofng: a new GNU profiler
  2021-10-08 16:23   ` Florian Weimer
  2021-10-08 17:59     ` Ruud van der Pas
@ 2021-10-11 20:00     ` Vladimir Mezentsev
  1 sibling, 0 replies; 16+ messages in thread
From: Vladimir Mezentsev @ 2021-10-11 20:00 UTC (permalink / raw)
  To: Florian Weimer, binutils


On 10/8/21 9:23 AM, Florian Weimer wrote:
>> gprofng archive EXPERIMENT
>>
>> Archive the associated application binaries, load objects and source
>> files in an existing experiment directory to make it self contained.
> This looks very useful.  Can it be generalized to support coredumps?

  This question is not for gprofng.
I would like to have the self-contained core file too. Something like

% gdb-archive core


If we tell about core files, I suggest adding two possibilities in Linux:
1. If an application is running interactively, run gdb and attach to the
process instead of creating the core file.
2. Run pstack instead of creating the core file.


-Vladimir

> So that it is possible to get identical debugging experience on a
> system where the necessary prerequisites are not installed?


^ permalink raw reply	[flat|nested] 16+ messages in thread
end of thread, other threads:[~2021-10-11 20:00 UTC | newest]

Thread overview: 16+ messages (download: mbox.gz / follow: Atom feed)
-- links below jump to the message on this page --
     [not found] <f01abee8-b329-0e39-2cef-0a0cec0adda4@oracle.com>
2021-08-11 21:10 ` [PATCH] gprofng: a new GNU profiler Vladimir Mezentsev
2021-08-11 21:48   ` Joseph Myers
2021-08-11 22:27     ` Vladimir Mezentsev
2021-08-12 12:49       ` Joseph Myers
2021-08-12 14:50         ` Joseph Myers
2021-08-12 23:35         ` Vladimir Mezentsev
2021-08-13 16:25           ` Joseph Myers
2021-08-16 20:06             ` Vladimir Mezentsev
2021-08-16 20:35               ` Joseph Myers
2021-08-12 11:48   ` Jose E. Marchesi
2021-08-13 20:22   ` Jim Wilson
2021-08-14  5:09     ` Ruud van der Pas
2021-08-16 12:02       ` Ruud van der Pas
2021-10-08 16:23   ` Florian Weimer
2021-10-08 17:59     ` Ruud van der Pas
2021-10-11 20:00     ` Vladimir Mezentsev
This is a public inbox, see mirroring instructions
for how to clone and mirror all data and code used for this inbox;
as well as URLs for read-only IMAP folder(s) and NNTP newsgroup(s).